Some weird shit from a simulation I wrote this week
A few days ago I started building an agent-based simulation to study how cooperation dynamics produce and sustain marginalization. I’m a game developer by trade, not a researcher. I’m learning this field as I go. I just ran my first real experiment. The results weren’t what I expected, and I’m posting them here as a lab notebook entry, not a finding. Something to sit with while I figure out what’s actually happening.
The findings are at the bottom of the page. Take a look.
What I built
The simulation is small. Agents have energy that depletes over time. They die when they run out. They can pair up with other agents to attempt joint ventures which are able to cooperate, burn energy, maybe succeed and gain resources, maybe fail and lose them. When they succeed together, their trust in each other goes up. When they fail, it goes down. Partner selection is biased by trust. New agents enter the population periodically. That’s most of it.
On top of that core, I added a trait system. Each agent has a visible marker, think of it as a category label. Crucially, the marker has no causal connection to cooperative quality. Two agents with the same marker aren’t actually any better at cooperating than two with different markers. The markers are pure signal, carrying no information.
The mechanism I wanted to study: when agent A has a good outcome with agent B, A’s trust in B goes up and also A’s trust in agents-who-share-B’s-marker goes up a bit. Same for bad outcomes, inverted. Individual experiences generalize to category-level expectations. This is how statistical discrimination is supposed to work, you’ve been burned by someone with marker X, now you’re a little more wary of everyone with marker X even though the next one had nothing to do with the last one.
The experiment: run the simulation with that generalization mechanism turned off (markers exist but are ignored), and with it turned on (markers drive partner selection). 12 seeds per condition. 30,000 ticks each. Compare.
What happened
Three plots. I’ll describe what I see, not what I think it means.
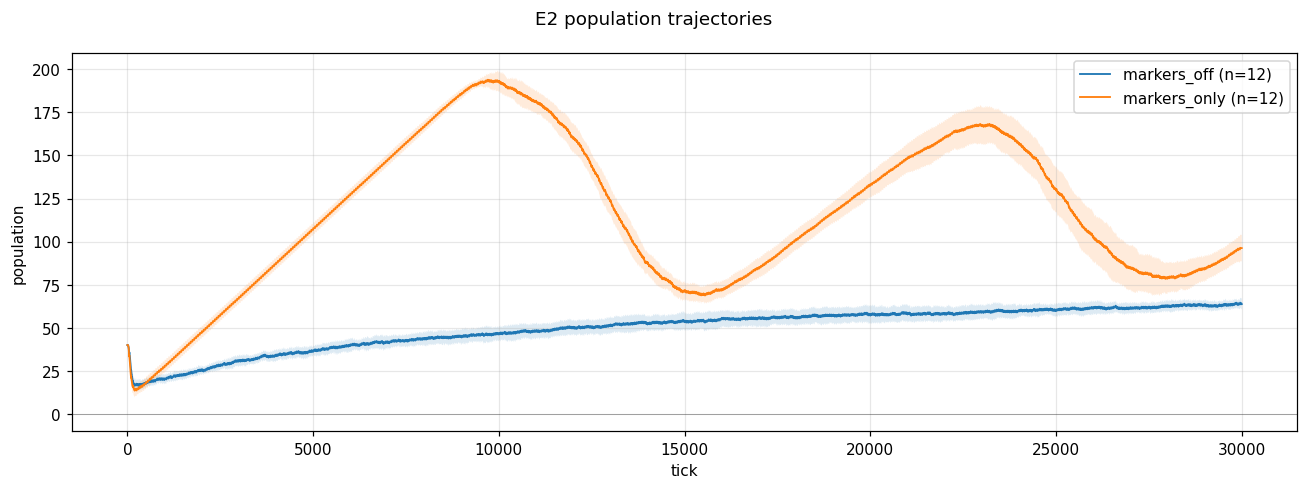
Population trajectories. In the markers_off condition, population grows slowly from about 20 to about 65 over 30k ticks. Smooth curve. Standard carrying-capacity behavior. In the markers_only condition, population grows much faster, peaks around 195 at tick 10k, crashes back to 70 by tick 15k, grows again to 170 by tick 23k, crashes again. Oscillating waves, roughly 3-4x the markers_off baseline at peaks.
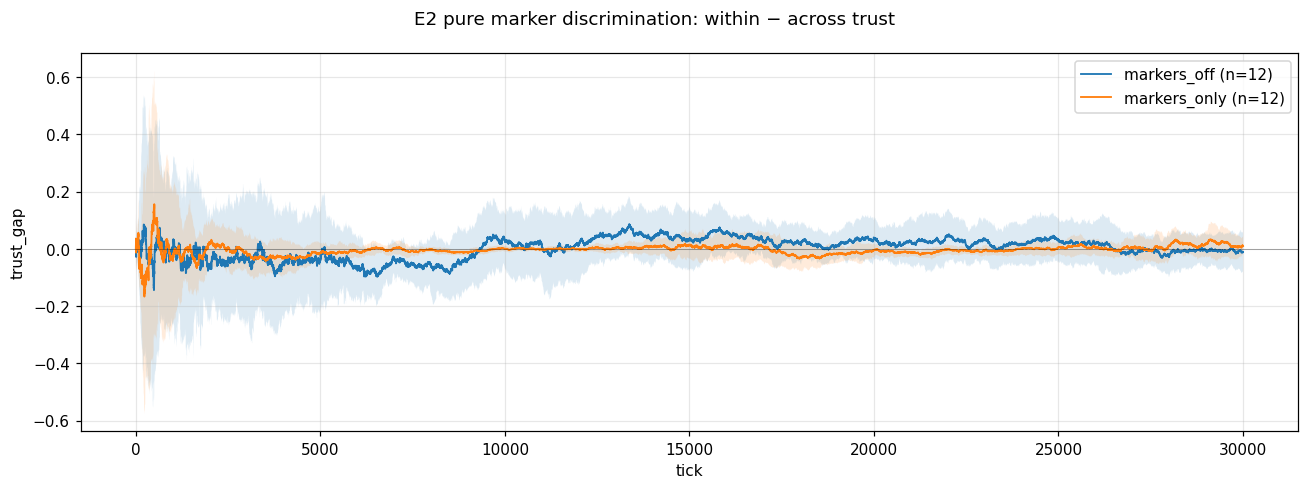
Within-group trust gap. This is the difference between within-group trust (how much agents trust their own kind) and across-group trust (how much they trust others). If the discrimination mechanism were producing what the literature predicts, this gap should open up over time, positive, widening. It doesn’t. Both conditions hover near zero throughout. Noisy, no clear trend.
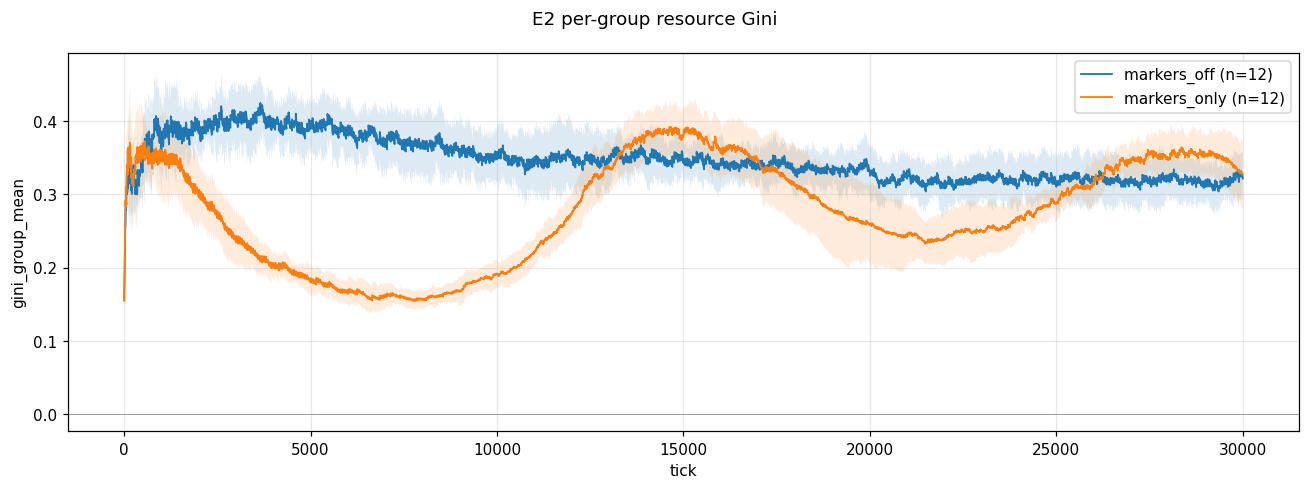
Per-group resource Gini. In markers_off, Gini sits around 0.35-0.40 fairly steadily. In markers_only, Gini starts higher, drops to around 0.18 by tick 8k, climbs back up to 0.40 around tick 14k, drops again, climbs again, tracking the inverse of the population wave.
What I expected
I expected the markers_only condition to produce clear categorical stratification. One group doing well, another group doing worse. Divergent mean resources across categories. A widening trust gap as in-group trust strengthened and cross-group trust decayed. Something that looked like a mechanized version of what I’ve watched happen in the world my whole life.
I got something else.
What might actually be going on
Four readings are live. I don’t know which is right yet.
Reading 1: Markers are functioning as a coordination signal, not a discrimination signal. When agents can identify their own kind, they can find reliable partners faster. Same-marker pairs form stable cooperative relationships not because same-marker actually predicts quality, but because the marker provides a cheap filter that reduces search costs. In-group cooperation succeeds locally. Population grows past what random partnering could sustain. No stratification emerges because both groups are doing the same thing. This is a known phenomenon in the evolutionary cooperation literature, “tag-based cooperation” or “green-beard effects”, but I didn’t expect it to dominate my setup.
Reading 2: The trust gap being zero doesn’t mean no discrimination, it means no cross-group data. If agents almost exclusively partner with their own kind, there are no cross-group interactions to build cross-group trust on. The trust gap is zero because the across-group side has no signal, not because trust is equal. This would look identical to reading 1 in my current metrics. I need to count cross-group interactions to tell them apart.
Reading 3: The boom-bust oscillation is a carrying-capacity dynamic that only shows up at high population density. The markers_only condition succeeds so well at cooperation that the population grows past what the resource regeneration can support. Crash. Regrow. Crash. The markers_off condition never gets big enough to hit this ceiling. If this is right, I’m looking at two fundamentally different dynamical regimes, not “discrimination on vs off.”
Reading 4: Within-group equity and between-group stratification can coexist. The Gini I’m plotting is per-group, within-group inequality, averaged across groups. If groups are internally equal but differ from each other in mean resources, my metric misses it. I need whole-population Gini and per-group means to see stratification if it’s there.
These aren’t mutually exclusive. Multiple could be true at once.
The uncomfortable part
I went into this hoping to demonstrate the mechanism of marginalization. What the simulation produced instead is something that looks like a mild defense of tribalism, “markers help populations coordinate even when the markers are arbitrary.” That’s uncomfortably close to arguments that get deployed in bad faith to justify actual discrimination.
I’m sitting with that. The simulation doesn’t care what I hoped it would show. What it actually produces is what I have to work with. Whether the finding holds up after more careful measurement, and whether the “coordination benefit” reading survives the diagnostic experiments, is something I’ll find out over the next several weeks. If it does hold up, it doesn’t validate real-world discrimination, the real world has vastly more going on than my toy simulation, but it does mean the story I was going to tell is more complicated than I thought it was.
My code might be trash, and if it is, so it goes. If not, this is just a data point.
What I’m doing next
Four diagnostic measurements, in order:
- Count same-group vs cross-group interactions per tick. If markers_only has essentially zero cross-group interactions, reading 2 is likely right.
- Plot per-group mean resources over time. If they diverge, there’s stratification my current metrics are missing.
- Plot whole-population Gini in addition to per-group. Between-group stratification would show up there.
- Distribution of trust values within and across groups at several time points, not just the mean gap.
I’ll post what I find. Might be that the expected marginalization dynamics are hiding behind measurement choices I didn’t make. Might be that the simulation is genuinely producing something different from what I predicted. Either way, I’ll know more than I know now.
Why I’m doing this
I grew up in and around Flint and Saginaw, MI. I saw the machinery that removes people from their labor. I came to this question from my own experience of marginalization and from watching what it did to friends who didn’t make it through. Building a simulation of the mechanism is a way of externalizing something I’ve carried for a long time, making the machinery visible and manipulable in a form I can study.
I don’t know if I’ll ever contribute anything to the actual research literature. I’m learning as I go, from outside academia, with my weird brain and a hobbyist’s time budget. But the work is satisfying in a way I haven’t found before, and I’m going to keep doing it. More of these coming as I learn more about the field.
If the results hold, the results hold. If I’m wrong about what they mean, I’ll be wrong in public and update. That’s the deal.
Here is the code. Please, critique away. My email is in the contacts section.
Much love, take care of each other.
MarkersOnly Condition
|
|
MarkersOff Condition
|
|